Showing posts with label CI/CD. Show all posts

Wednesday, June 1, 2022

Stress test your cloud applications with Azure Chaos Studio

Azure Chaos Studio makes it possible to stress test your applications directly from Azure, and can significantly help in your business continuity and disaster recovery (BCDR) strategies.
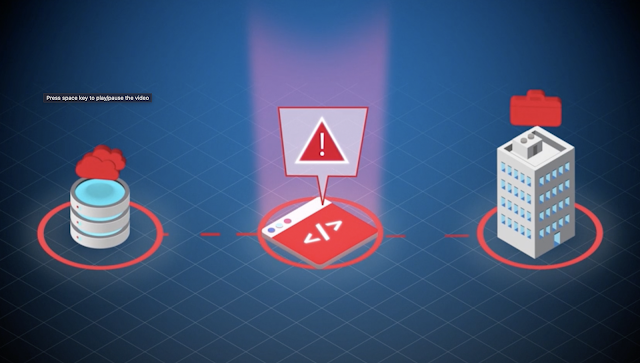
Azure Chaos Studio
Source: Azure

Azure Chaos Studio is a new service in Azure that allows you to test and improve the reliability of your applications. With it, teams can quickly identify weak spots in their architecture, addressing the enterprise goals of business continuity and disaster recovery (BCDR).

Subjecting applications to real or simulated faults allows observing how applications respond to real-world disruptions.

Running chaos experiments used to be a complex task and required deploying very complex workloads. But with Chaos Studio it just became less complex, due to its availability from the Azure portal.

Azure Chaos Studio - Console
Source: Azure

What is Chaos Engineering?

Chaos engineering is a practice that helps teams measure, understand and improve their cloud applications by submitting those application to failures in controlled experiments. This practice helps identifying weak spots in your architecture, which if fixed, increases your service resilience.

Why Chaos Engineering?

The problem that Chaos Studio tries to solve is not new. Disaster recovery and business continuity are usually treated very seriously by organizations as outages can significantly impact reputations, revenues, and much more.

That said, practicing chaos engineering is a must for organizations actively working on business continuity and disaster recovery (BCDR) strategy. These drills ensure that applications can recover quickly and preserve critical data during failures.

Another important factor to consider is high availability (HA). Chaos Engineering helps validating application resilience against regional outages, network configuration errors, high load, and more.

Features

Some of the most interesting features provided by Azure Chaos Studio are:

  • Test resilience against real-world incidents, like outages or high CPU utilization
  • Reproduce incidents to better understand the failure.
  • Ensure that post-incident repairs prevent the incident from recurring.
  • Prepare for a major event or season with "game day" load, scale, performance, and resilience validation.
  • Do business continuity and disaster recovery (BCDR) drills to ensure that your application can recover quickly and preserve critical data in a disaster.
  • Run high availability (HA) drills to test application resilience against region outages, network configuration errors and high stress events.
  • Develop application performance benchmarks.
  • Plan capacity needs for production environments.
  • Run stress tests or load tests.
  • Ensure that services migrated from an on-premises or other cloud environment remain resilient to known failures.
  • Build confidence in services built on cloud-native architectures.
  • Validate that live site tooling, observability data, and on-call processes still work in unexpected conditions.

How to get started

Getting started with Azure Chaos Studio is simple, just log into your Azure Account and follow these steps.

References

Thursday, April 1, 2021

Building and testing Node.js apps with Azure DevOps Pipelines

Learn how to built, test and run code coverage analysis on a Node.js app using Azure DevOps Pipelines
Photo by Chirstopher Gower on Unsplash

Setting up an Azure DevOps pipeline is not too complicated. On this tutorial, let's learn how to setup a simple pipeline to a basic Node.js app so we can build, test and capture test results and report code coverage analysis, exposing them to everyone in the team.

On this tutorial we will:

  • Create a new DevOps Pipeline
  • Build our project
  • Configure DevOps to read the outputs of our tests and test coverage

Sample Project

This tutorial can be executed using this repository. 

Setting up a Connection

To get started, we have to grant Azure DevOps access to your external repo, GitHub on this case. To configure a new connection, click on Project Settings on the bottom left in your navigation bar:

Then click on Boards -> GitHub connections:

Now, click on New Connection:

And click Connect your GitHub account:

Finish the integration by entering your username/password and authorizing access to your GitHub account and repositories.

Creating a new DevOps Pipeline

Now that your Azure DevOps has access to your GitHub repos, let's build our first pipeline. Click on Pipelines -> New Pipeline on top right to create a new one:

Choose a source repository

Next, select where your project is located. Since we're using GitHub for this demo, click on it:

And choose, one of your existing repositories:

Configuring the Pipeline

Next, DevOps will ask you to specify your project type. Since we're building a Node.js project, choose it from that list:

Click Next and you should see a default build yaml for your new project that should look more a less like this:

pool:
  vmImage: 'ubuntu-latest'

steps:
- task: NodeTool@0
  inputs:
    versionSpec: '10.x'
  displayName: 'Install Node.js'
- script: |
    npm install
    npm run build
  displayName: 'npm install and build'

Running our first build

If all your dependencies can be satisfied by npm, most likely your project can be built so click Save and run so that DevOps builds your project for the first time:

By clicking on the columns on the left, we can even inspect the result of the build. For example, here's the output of npm install and build:

Coming back to out pipeline page, we get our first successful build:

Step 4 - Setup Unit Test reporting

But as good as the initial template is, it does not auto-enable unit-testing and code coverage reporting, so let's set it up. To change the pipeline in the future, click on the Dots menu -> Edit Pipeline:

You'll be redirected to the editor. On the Tasks menu on the right, type test results and click on Publish Test Results to add it as a new task in our azure-pipelines.yml file:

Next screen, select JUnit, follow the configuration below and click Add:

Step 5 - Setup Code Coverage reporting

Similarly, type code coverage on the Tasks menu on the right, to add the code coverage task:

And set:

  • Coverage tool: Cobertura
  • Summary file: coverage/cobertura-coverage.xml

Review and Save

The above steps should have added something similar to the below on your azure-pipelines.yml:

- task: PublishTestResults@2
  inputs:
    testResultsFormat: 'JUnit'
    testResultsFiles: '**/TEST-*.xml'
- task: PublishCodeCoverageResults@1
  inputs:
    codeCoverageTool: 'Cobertura'
    summaryFileLocation: 'coverage/cobertura-coverage.xml'
The menus and buttons we clicked are nothing more than helpers to add the above code. Feel free to explore the editor and properties for each field since it contains intellisense.

Click Save and Run again to produce a new build. Once your build is finished, it should show up in the pipeline's main screen:

Reviewing Test Results and Test Coverage

To wrap it up, let's review our test results/coverage reports. Clicking on the second build should take you to the build page:

Highlighted in the above image, both are links that take us to the tests page so we can review test results:

Cool, isn't it? Clicking on the cover tests link above, we're taken to the Code Coverage page where we're able to see the code coverage in our project:

Conclusion

On this article we reviewed how to setup a simple Azure DevOps pipeline to build, test and report code coverage for a basic NodeJS app exposing them in the build. Azure DevOps is a pretty powerful CI/CD system but unfortunately, often ignored by the community. Feel free to explore it!

Source Code

As always, the source code for this post is available on my GitHub.

References

See Also

About the Author

Bruno Hildenbrand      
Principal Architect, HildenCo Solutions.